Introduction
Inspired by Wind, Earth and Air, I wanted to understand the mechanisms behind this type of visualization and see if I could apply this on data available from SMHI.
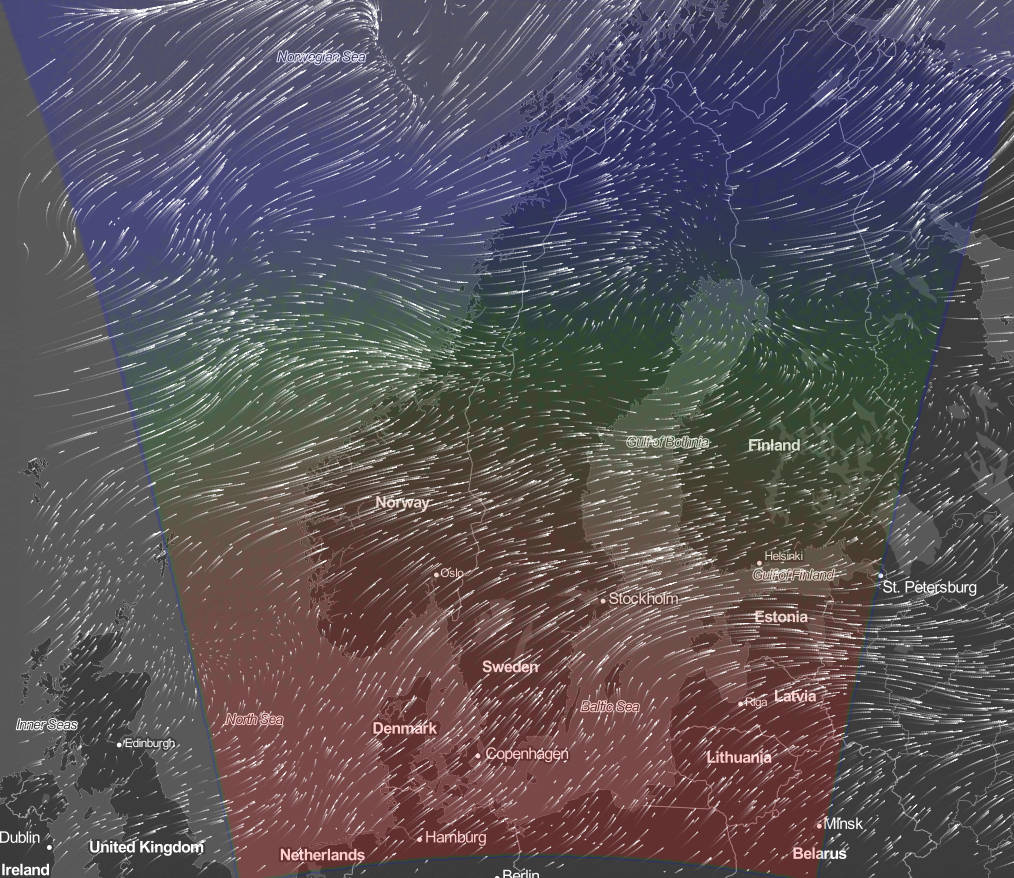
My implementation is demonstrated here. The implementation is available at GitHub, here
The algorithms behind this type of dynamic visualizations is not well described, and the implementation in Javascript is not easily understood. What follows is my annotations and is not complete, but at least is might give a starting point for anyone interested digging more into this.
The leaflet-velocity plugin, takes input data in a specific format (see below) and from this data, which is
expected to be in a grid with data in latitude/longitude order, it makes a "smooth" surface using
bilinear interpolation. This will interpolate values between
the grid points over the geographical area and thus create a smooth surface. Then, the plugin will generate random
coordinates that will be the origin of 'particles' that will be visualized moving in the interpolated wind field.
The particles are drawn with specific length, colorscale etc and correlate with wind speed and directions. After a
ceratin 'age' the particle will disappear and a new particle will be regenerated. The 'age' of a particle is the number
of frames drawn and defaults to 90. This logic is implemented in the plugin functions evolve (which call randomize),
then draw is called.
In the following, I will describe in some sections:
- The collection of basic wind data from SMHI and how this is transformed into a correct format
- The usage of Leaflet and its leaflet-velocity plugin
Wind data
The first thing is to find relevant wind data. This can be observations, or forecasts based on meteorological models. The Swedish Meteorological and Hydrological Institute have this available as open data. An entry point for this data is here (in Swedish).
SMHI
After some investigation at SMHI, I decided to use the forecast model named "PMP3g". This is a forecast mdodel that is quality controlled and is used for services provided by SMHI. Data is provided at discrete locations in a grid, the distance between each grid point is 2.8 km, the coverage includes all Nordic countries, Batic countries and parts of other countries in the region. Hence it is a large area with many grid points.
The model is described here. (in Swedish). Some notes:
- The model is updated at least 6 times per day
- Data is available through HTTP requests and returned JSON format
- The data is available as prognosis up to 240 hours in time
- There are many parameters available, refer to this page
- In this case the parameters are
wd(wind direction) andws(wind speed) - It is possible to get data for single grid points, or for the entire grid. For the latter, it is possible to downsample, see below.
The base URL to use is https://opendata-download-metfcst.smhi.se/api/category/pmp3g/version/2/.
First we want to get a list of available parameters, so we add parameter.json to the base URL and
request information. In the response we check if ws (wind speed), wd (wind direction) and msl (mean sea level?)
for air pressure (I visualize this parameter together with wind speeds and directions).
The second thing to check is valid times, we add geotype/multipoint/validtime.json to the base URL. The valid time is
used to request the data we are looking for. I select the first time in the response, which is a list of forecasted times.
Now we can request data from SMHI using the information we obtained above. In the request we can include if we want to
downsample the information (a good idea, to reduce the amount of information) and if latitudes/longitudes for the data
should be included with with-geo parameter setting (True/False). We need latitudes/longitudes for visualization.
For the python implementation, refer here.
Formatting data for leaflet-velocity
The leaflet-velocity simply states "Data input format is the same as output by wind-js-server, using grib2json.", which is not very helpful at first instance.
wind-js-server is a server implementation for converting
GRIB2 data to JSON, the leaflet-velocity assumes data in JSON format.
GRIB is a standardized format used in meteorology, GRIB2 is the second version. The format is binary.
But SMHI is not providing data in GRIB format, but in JSON, so I need to convert from SMHI JSON format to the JSON
format expected by leaflet-velocity. After some digging into leaflet-velocity source code, I was able to define the
format. It looks as follows:
wind_data = [{'header':{...} ,'data':[...]}, {'header':{...} ,'data':[...]}]
wind_data is a list of 2 dictionary elements. Each dictionary element consist of a 'header' element and a 'data' element.
The header information elements are:
- parameterCategory: integer, fixed value 2
- parameterNumber: integer, either 2 ("U-component_of_wind") or 3 ("V-component_of_wind") when parameterCategory == 2
- lo1: float, grid origin (longitude)
- la1: float, grid origin (latitude)
- dx: float, distance between grid points in x-direction (longitudes)
- dy: float, distance between grid points in y-direction (latitudes)
- nx: integer, number of grid points W-E (longitudes)
- ny: integer, number of grid points N-S (latitudes)
- refTime: date when observation was made, iso-format: "2017-02-01T23:00:00Z"
Note that nx * ny must be equal to the length of the data list.
'data' is a list of float values, each representing a wind vector component (u or v).
The length of each data list must be the same. The magnitude of the wind vector is calculated by:
Math.sqrt(u * u + v * v). The u-component of wind-vector is calculated as u = wind_speed * cos(wind_direction) and
the v-component as v = wind_speed * sin(wind_direction). Thus, u- and v-components are the polar representation of
wind vectors. wind_direction are given in degrees, but as North in meteorology is historically defined as 0 degrees,
but mathematically as 90 degrees, we need to adjust this as: u = wind_speed * cos(270 - wind_direction).
Finally, cos and sin in Python assumes the argument in radians, so we need to convert from degrees.
A reference for the paragraph above is here.
As an example, the header of wind_data can look like this:
wind_data = [{'header': {'parameterCategory': 2,
                         'parameterNumber': 2,
                         'lo1': -7.717702,
                         'la1': 71.249256,
                         'dx': 4.394713100000001,
                         'dy': 1.5624013333333338,
                         'nx': 11,
                         'ny': 13,
                         'refTime': '2021-11-09T19:00:00Z'},
             'data': [...]},
             {'header': {'parameterCategory': 2,
                         'parameterNumber': 3,
                         'lo1': -7.717702,
                         'la1': 71.249256,
                         'dx': 4.394713100000001,
                         'dy': 1.5624013333333338,
                         'nx': 11,
                         'ny': 13,
                         'refTime': '2021-11-09T19:00:00Z'},
              'data': [...]}]
data is a list of float values, equal to nx * ny in length, u or v components values respectively.
leaflet-velocity builds a grid by first using u/v values in W-E direction using header element nx, then in N-S
using ny.
See the javascript below, copied from leaflet-velocity.
    ni = header.nx;
    nj = header.ny; // number of grid points W-E and N-S (e.g., 144 x 73)

    grid = [];
    var p = 0;
    var isContinuous = Math.floor(ni * Δλ) >= 360;

    for (var j = 0; j < nj; j++) {
      var row = [];
      for (var i = 0; i < ni; i++, p++) {
        row[i] = builder.data(p);
      }
      if (isContinuous) {
        // For wrapped grids, duplicate first column as last column to simplify interpolation logic
        row.push(row[0]);
      }
      grid[j] = row;
    }
This implies that u/v data values needs to be sorted accordingly West to East, then North to South. In the python script (windy.py) this is done as per below.
# Sort first on lon/W-E (column 0), then lat/N-S (column 1), lexsort uses reversed order
# See https://stackoverflow.com/a/64053838
ind = np.lexsort((self.wind[:, 1], self.wind[:, 0]))
self.wind = self.wind[ind]
For the rest of the implementation refer to windy.js and windy.html in the
html directory.