This is a description on how to use D3, Data Driven Documents, to visualize and manipulate maps objects.
The end result is visible here. The project is available on Github (link).
Making a map of Sweden
First, we need to find some data describing the geometry we want. While there are several sources to choose from, in this case I will be using Natural Earth that are providing a wealth of datasets in different scales for free. As I'm interested in Sweden and some of its administrative subunits (countys) for my project, only a selection of shapefiles is needed. Below I provide links to zip-archives for shapefiles in the scale of 1:10 million.
For the first zip-archive link, according to Natural Earth it includes:
Countries subdivided by non-contiguous units. Mainland metropolitan France separate from the island of Corsica. These rarely correspond to actual administrative divisions but rather highlight geographical regions that are not continuous but are part of the same country. (Link)
For the second zip-archive link, Natural Earth says that we get:
Internal, first-order administrative boundaries and polygons for all but a few tiny countries. (Link)
The third link includes shape files city and town points:
Point symbols with name attributes. Includes all admin-0 and many admin-1 capitals, major cities and towns, plus a sampling of smaller towns in sparsely inhabited regions. (Link)
We now have shapefiles which includes the geometry we want to use as a subset. How do we go from here? For the purpose of rendering using D3, we need to filter out the geometries I'm looking for, then transform the geometries from the original format in a 2-step approach; first transform into GeoJSON and then into TopoJSON. For this we need to use tools, the ogr2ogr tool and topjson respectively.
ogr2ogr is part of GDAL and official binaries for download can be found here.
For Mac, go this way
$ brew install gdal
On a raspberry pi, running raspbian, the following commands should work (I have not tried):
$ sudo apt-get update
$ sudo apt-get install gdal-bin
topojson tool is installed (on Mac at least) by
$ npm install -g topojson@1
(Install npm using this command: $ brew install node)
Unzip the shapefiles above, then try
$ ogr2ogr -f GeoJSON -where "ADM0_A3 = 'SWE'" subunits.json ne_10m_admin_1_states_provinces.shp
This should produce a new file subunits.json. The input parameters to ogr2ogr is straightforward:
- -f GeoJSON says that the output file format should be GeoJSON, subunits.json is the name of the output file and ne_10m_admin_1_states_provinces.shp is the input file.
- -where is the filter parameter with a SQL-like syntax, the trick is here to know that we want to filter on the condition that ADM0_A3 should be equal to SWE. ADM0 refers to Admin-0, the highest level administrative boundaries, and A3 refers to ISO 3166-1 alpha-3 country codes.
Now we can convert from GeoJSON to TopeJSON using topojson tool like so
$ topojson -o swe.json --properties -- subunits.json
Here we ask topojson to create output file swe.json and use subunits.json as input. If everything is working correctly, we now have swe.json in topoJSON format that D3 can read and display, shown below.
Use D3 to draw a map
Let's start using D3, a javascript library to manipulate HTML documents using data. We need to combine D3 with a simple HTML document, the skeleton for the HTML5 document is
<!DOCTYPE html>
<html lang="en">
<head>
    <meta charset="UTF-8">
    <title>Map</title>
    <script src="//d3js.org/d3.v3.js" charset="utf-8"></script>
    <script src="//d3js.org/topojson.v1.js"></script>
</head>

<body>

<script>
</script>

</body>
</html>
Now we need to include some D3 javascript code between the <script> and </script> tags. Like so,
const width = 1000;
const height = 600;

let svg = d3.select("body")
    .append("svg")
    .attr("width", width)
    .attr("height", height);
let projection = d3.geo.mercator()
    .center([14.6, 62.1])
    .scale(1000)
    .translate([width / 2, height / 2]);
let path = d3.geo.path().projection(projection);

d3.json("swe.json", function (d) {
    svg.selectAll("map")
        .data(topojson.feature(d, d.objects.subunits).features)
        .enter()
        .append("path")
        .attr("style", "fill: grey")
        .attr("d", path);
});
And that's it really, if we combine this together into a html file, e.g. swe.hmtl, and bring this up in a browser we should see a map of Sweden.
What is the javascript code doing?
In the let svg = ..., I use the D3 selection - selecting the <body>-tag in the HTML code and appending an <svg>-tag with 2 attributes width and height. The projection variable is pointing to the d3 mercator function (this is a standard cylindrical map projection). To this I center the map on the geographical mid point of Sweden (lat 62.1, lon 14.6), scale the image with factor 1000 and translate all coordinates to the mid-values of width and height. Finally, I define the svg-path variable using the projection.
d3.json() function reads the json-formated file swe.json that we created before. Then we use the selectAll function to add the tag <map> to svg for all data. The data is generated through the function call to topojson which will return an array of datapoints to draw.
There is plenty of sites explaining and describing D3, so I am sketchy here.
Result visible here.
We get something like this.
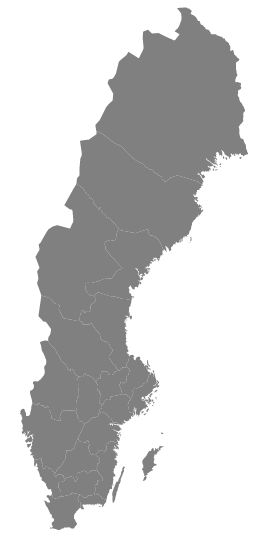
Map of Sweden
Variations of the map
We can do more, for example include places by doing this
$ ogr2ogr -f GeoJSON -where "ISO_A2 = 'SE' AND SCALERANK <8" places.json ne_10m_populated_places.shp
$ topojson -o swe.json -- subunits.json places.json
From the populated_places shape file (ne_10m_populated_places.shp) we have now filtered on Sweden using ISO 3166-1 alpha-2 2 letter code instead of the previous 3 letter code (the choice of letter codes seems to be somewhat arbitrary...) and the major cities by using SCALERANK (see here on SCALERANKS). Then we append this javascript code to draw the places:
svg.append("path")
    .datum(topojson.feature(d, d.objects.places))
    .attr("d", path)
    .attr("class", "place");