Now its time to make use of the data collected from SMHI and visualize them on top of the map of Sweden. As been shown in Map of Sweden #2, an HTTP client can retrieve data from a server, this is done through jQuery. A simple snippet like this
function get_clover_data() {
    $.ajax({
        url: "/clover_data",
        method: 'GET',
        dataType: 'json',
        cache: false
    }).done(function (series) {
        weather = series;
    });
}
If the ajax-call is successful, the JSON formatted data is copied into the variable weather. All observations are included. To access, for example, the average temperature for the first station do weather['avg_temp'][0].val. As I only use one observation at a time for visualization, I extract the observation I want for visualization. This is done like so
function get_values(key) {
    let lst = [];
    let max_val = min_val = weather[key][0].val;

    for (let stn = 0; stn < weather[key].length; stn++) {
        if (weather[key][stn].active) {
            // Transform coordinates according to the selected projection
            let xy = projection([weather[key][stn].lon, weather[key][stn].lat]);
            lst.push({
                x: xy[0],
                y: xy[1],
                station: weather[key][stn].station,
                val: weather[key][stn].val,
                nr: stn.toString()
            });
            max_val = Math.max(max_val, weather[key][stn].val);
            min_val = Math.min(min_val, weather[key][stn].val);
        }
    }
    return {key: key, val: lst, max: max_val, min: min_val, date: weather.date};
}
Some comments
- Observations are accessed with the "key" (e.g. 'avg_temp') first, then a station (as a number) and finally the value as in weather[key][stn].lon.
- There is a call to projection that transform the longitude and latitude values for the station. The projection were discussed in Map of Sweden #1.
Now we got a JSON-list with fields for the selected key after calling get_values. It is time to visualize these on top of the map of Sweden. We do this by calling the javascript function render_map, below. But, first we got to fix the file "swe.json".
$ curl http://naciscdn.org/naturalearth/10m/cultural/ne_10m_admin_0_countries.zip -O
$ unzip ne_10m_admin_0_countries.zip
$ ogr2ogr -f GeoJSON -where "ADM0_A3 = 'SWE'" subunits.json ne_10m_admin_0_countries.shp
$ topojson -o swe.json --properties -- subunits.json
const width = 1000;
const height = 600;

let svg = d3.select("body")
    .append("svg")
    .attr("width", width)
    .attr("height", height);
let projection = d3.geo.mercator()
    .center([14.6, 62.1])
    .scale(1000)
    .translate([width / 2, height / 2]);
let path = d3.geo.path().projection(projection);

function render_map(values) {
    let colors = d3.scale.quantize()
        .domain([values.min, values.max])
        .range(['#9e0142','#d53e4f','#f46d43','#fdae61','#fee08b',
                '#e6f598','#abdda4','#66c2a5','#3288bd','#5e4fa2'].reverse());

    d3.json("swe.json", function (error, se) {
        let voronoi = d3.geom.voronoi()
            .x(function (d) {
                return d.x;
            })
            .y(function (d) {
                return d.y
            });

        svg.selectAll("clip")
            .data(topojson.feature(se, se.objects.subunits).features)
            .enter()
                .append("defs")
                .append("clipPath")
                .attr("id", "swe-clip")
                .append("path")
                .attr("d", path);

        svg.selectAll("voronoi")
            .data(voronoi(values.val))
            .enter()
                .append("path")
                .attr("clip-path", "url(#swe-clip)")
                .attr("fill", function (d) {
                    return colors(d.point.val)
                })
                .attr("d", function (d) {
                    return "M" + d.join("L") + "Z";
                })
                .attr("style", function (d) {
                    return "stroke: " + colors(d.point.val)
                });
    });
}
Above assumes that the variable weather is available. I do this by include a file through <script src="weather.js"></script> in the <head>-section to keep it simple (in my real implementation the data is accessed through a jQuery ajax-request, see Map of Sweden #2), see the implementation of this blog posting at Github.
Running the javasript should produce this.
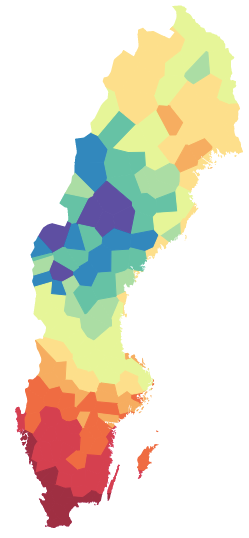
Average temp
How does this work?
The contants and variables before render_map was explained in Map of Sweden #1
In render_map a color D3-variable is defined; the domain of the variable is the min and max values of the observation to render, the range is a color scale generated through colorbrewer. In practice this means that a value of the observation is mapped to a specific color, in this case there are 10 colors going from blue to red. (Colorbrewer generates a scale going from red to blue, but I want the lowest value to mapped to blue and the highest to red, thus I reverse the array).
Using the color for a specific value, I want to use an area centered around the station where the measurement have been made. For this purpose I use a voronoi diagram. In simple terms, this type of diagram partition the map into areas where all pixels are closest to the station point (closest Euclidian distance). D3 makes this possible by the voronoi-function. I do this by declaring the voronoi-variable. However, to have this working, I need to clip all voronoi areas to stay within the map of Sweden. This is made by defining a "clipPath" with id swe-clip, which is referenced later on using url(#swe-clip).
In summary, the logic of the render_map function is
- Define the color mapping in the variable color
- Read the file swe.json (which contain, in topoJSON format, the geometry for Sweden in the highest adminstrative level from Natural Earth)
- Define the voronoi variable
- Generate a SVG clipPath with id swe-clip
- Draw the map of Sweden using a voronoi diagram, filling each area with a color that is mapped through the variable color. Each area is clipped according to the swe-clip definition. The last style-attribute, removes the visible borders of the voronoi areas by drawning them in the same color as the area was filled with.